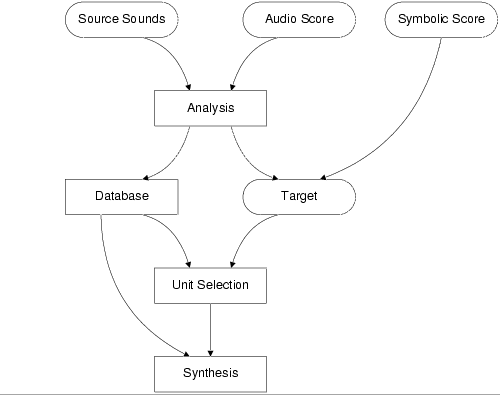
Figure 1: Overall structure of the data-driven Caterpillar
system, arrows representing flow of data.
Abstract: In speech synthesis, concatenative data-driven synthesis methods prevail. They use a database of recorded speech and a unit selection algorithm that selects the segments that match best the utterance to be synthesized. Transferring these ideas to musical sound synthesis allows a new method of high quality sound synthesis. Usual synthesis methods are based on a model of the sound signal. It is very difficult to build a model that would preserve the entire fine details of sound. Concatenative synthesis achieves this by using actual recordings. This data-driven approach (as opposed to a rule-based approach) takes advantage of the information contained in the many sound recordings. For example, very naturally sounding transitions can be synthesized, since unit selection is aware of the context of the database units. The Caterpillar software system has been developed to allow data-driven concatenative unit selection sound synthesis. It allows high-quality instrument synthesis with high level control, explorative free synthesis from arbitrary sound databases, or resynthesis of a recording with sounds from the database. It is based on the new software-engineering concept of component-oriented software, increasing flexibility and facilitating reuse.
Figure 1: Overall structure of the data-driven Caterpillar system, arrows representing flow of data.
The continuous features used for selection are: pitch, energy, spectral tilt, spectral centroid, spectral flux, inharmonicity, and voicing coefficient. How these are computed is explained in [7].
Figure 2: Example of characteristic values of continuous features: The raw features (pitch and energy) result in mean µ and standard deviation s over the duration of the unit, indicated by the length of the dotted lines (top), and magnitude spectrum of the feature, spectral centroid g, and second order moment d (bottom).
Figure 3: [
Database explorer feature view: Each point represents a unit, plotted according to two selectable characteristic values of two features. Various characteristic values can be displayed with the units, e.g. min/max, the standard deviation, or the mean slope (the short lines extending from the units). The ellipse serves to interactively select the units for real-time acoustic exploration of the database. The currently played unit within the ellipse is highlighted by a little circle.]Database explorer feature view: Each point represents a unit, plotted according to two selectable characteristic values of two features. Various characteristic values can be displayed with the units, e.g. min/max, the standard deviation, or the mean slope (the short lines extending from the units). The ellipse serves to interactively select the units for real-time acoustic exploration of the database. The currently played unit within the ellipse is highlighted by a little circle.
D is a weighted sum of individual feature distance functions df:
| D(u, t, j) = |
|
wf df(u, t, j) (2) |
| p |
|
= C (u', ui) = |
|
wf cf(u', ui) (3) |
|
|
|||||||||||||||||||||||
|
(4) | |||||||||||||||||||||||
|
The Caterpillar system currently uses a weighted Euclidean distance function on the feature values, normalized by division by the standard deviation.
This document was translated from LATEX by HEVEA.