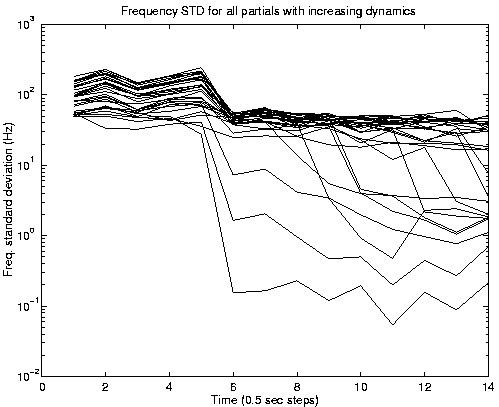
Figure 6: Standard Deviation of the Clarinet's Frequency fluctuations of the first 30 partials with increasing dynamics.
From the above experiment it appears that the problem lies in interpolation between partials that have very different regimes of fluctuations. Naturally, the first assumption about the origin of the big variance in frequency would be that partials close to the noise floor, i.e., the ones that are not sure to be actual partials but which are ``forced'' into the sinusoidal representation by the additive method, are the partials that have significant jitter. In such a case one might expect that:
To see the dependence of frequency fluctuations on the playing condition, we have recorded a sound with gradually increasing dynamics 1.
For each one of the partials, the frequency standard deviation over
500 msec. segments was calculated as a function of time.
As can be seen from figure 6, a drop in frequency
fluctuations occurs selectively for some partials as a function
of time and thus dynamics. For the other partials, the fluctuations
never drop to be close enough to zero.

A closer look at the numbers of partials whose fluctuations drop as a function of time reveals the following interesting order (sorted according to fluctuation value, from low to high):
Moreover, one can see that approximate harmonic relations exist between the different triplets of partials on the last line, according to the following combinations: (1 3, 4), (1 4, 5), (3 4, 7),(3 5, 8), (4 5, 9), (4 7, 11), (4 8, 12) and (3 9, 12), (7 8, 15) and (3 12, 15).
This phenomena is suggestive that the drop of variance is related to some sort of non-linear coupling phenomena that occurs between pairs of lower, already exisiting and stable frequencies, and new partials that appear and their sum frequency. 2